1. 有关 Matlab 获取代码关注WZZHHH回复关键词,或者咸鱼关注:WZZHHH123
怀俄明探空站数据解算PWV和Tm:怀俄明探空站数据解算PWV和Tm
怀俄明多线程下载探空站数据(包括检查和下载遗漏数据的代码):怀俄明多线程下载
对IGRAv2进行质量控制得到PWV和Tm的 matlab 代码:IGRAv2进行质量控制得到PWV和Tm
算 IGRAv2 探空站的 Tm 和 PWV:IGRAv2计算Tm和PWV
提取探空站 IGRAv2 全部数据:
ERA5 解算合集(温度、气压、PWV、水汽压和 Tm)代码获取:ERA5合集
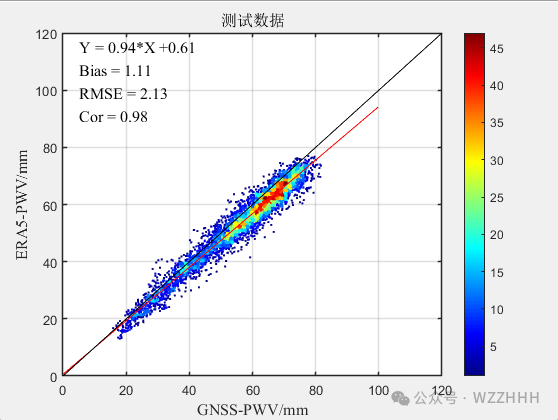
MATLAB画散点密度图
代码、测试数据的压缩包在文末,可自行下载测试出图效果
散点误差图出图效果
代码如下
具体使用,请自行修改
function scatter_plot(x,y,derror)
% 点状密度图
% 根据测试数据画的,实际应用自己修改
% --------------------改变密度大小------------------
numbins = 50;
% --------------------------------------------------

X =x;
Y =y;
% 找到最大值最小值
MaxSP=max(x);MaxV=max(y);Maxi=1.1*max(MaxSP,MaxV);

[values, centers] = hist3([X Y], [numbins numbins]);
centers_X = centers{1,1};
centers_Y = centers{1,2};
binsize_X = abs(centers_X(2) - centers_X(1)) / 2;
binsize_Y = abs(centers_Y(2) - centers_Y(1)) / 2;
bins_X = zeros(numbins, 2);
bins_Y = zeros(numbins, 2);
for i = 1:numbins
    bins_X(i, 1) = centers_X(i) - binsize_X;
    bins_X(i, 2) = centers_X(i) + binsize_X;
    bins_Y(i, 1) = centers_Y(i) - binsize_Y;
    bins_Y(i, 2) = centers_Y(i) + binsize_Y;
end
scatter_COL = zeros(length(X), 1);
onepercent = round(length(X) / 100);
for i = 1:length(X)
    if (mod(i,onepercent) == 0)
        fprintf('.');
    end
    last_higher_X = NaN;
    id_X = NaN;
    c_X = X(i);
    last_lower_X = find(c_X >= bins_X(:,1));
    if (~isempty(last_lower_X))
        last_lower_X = last_lower_X(end);
    else
        last_higher_X = find(c_X <= bins_X(:,2));
        if (~isempty(last_higher_X))
            last_higher_X = last_higher_X(1);
        end
    end
    if (~isnan(last_lower_X))
        id_X = last_lower_X;
    else
        if (~isnan(last_higher_X))
            id_X = last_higher_X;
        end
    end
    last_higher_Y = NaN;
    id_Y = NaN;
    c_Y = Y(i);
    last_lower_Y = find(c_Y >= bins_Y(:,1));
    if (~isempty(last_lower_Y))
        last_lower_Y = last_lower_Y(end);
    else
        last_higher_Y = find(c_Y <= bins_Y(:,2));
        if (~isempty(last_higher_Y))
            last_higher_Y = last_higher_Y(1);
        end
    end
    if (~isnan(last_lower_Y))
        id_Y = last_lower_Y;
    else
        if (~isnan(last_higher_Y))
            id_Y = last_higher_Y;
        end
    end
    scatter_COL(i) = values(id_X, id_Y);
end

% 拟合曲线
a=polyfit(x,y,1);
ax=linspace(0,Maxi+10,2000);
ay=a(1)*ax+a(2);

Str_yx=['Y = ',num2str(round(a(1),2)),'*X +',num2str(round(a(2),2))];


scatter(x, y, 20, scatter_COL, '.' );
hold on

colormap('jet');
colorbar;

xlabel('GNSS-PWV/mm','FontSize',12,'FontName','Times New Roman');
ylabel('ERA5-PWV/mm','FontSize',12,'FontName','Times New Roman');


bx = linspace(0,120,2000);

% 设置xy轴的界限
% xlim([0 120]);ylim([0 120]);

% 把误差表示在图上,位置根据自己需要改,我这是根据测试数据填的
text(5,115,Str_yx,'FontSize',12,'FontName','Times New Roman')
text(5,107,['Bias = ',num2str(round(100*derror(1))/100,'%.2f')],'FontSize',12,'FontName','Times New Roman')
text(5,99,['RMSE = ',num2str(round(100*derror(2))/100,'%.2f')],'FontSize',12,'FontName','Times New Roman')
text(5,91,['Cor = ',num2str(derror(3),'%.2f')],'FontSize',12,'FontName','Times New Roman')


% 画拟合曲线
plot(ax,ay,'r')
hold on

% 画对角线
plot(bx,bx,'k');
hold on

title('测试数据','FontSize',12)
box on
grid on

set(gca,'LineWidth',1.2)
end
压缩包地址如下:
压缩包里面的内容:
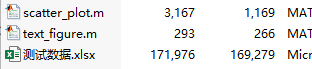
压缩包地址:
关注: WZZHHH,回复 MATLAB画散点密度图
>.< 有问题,请你问你的老师,师兄师姐。我也挺忙的。
本站资源均来自互联网,仅供研究学习,禁止违法使用和商用,产生法律纠纷本站概不负责!如果侵犯了您的权益请与我们联系!
转载请注明出处: 免费源码网-免费的源码资源网站 » MATLAB画散点密度图(附代码和测试数据的压缩包)

发表评论 取消回复