ELKFK实验
数据流向图
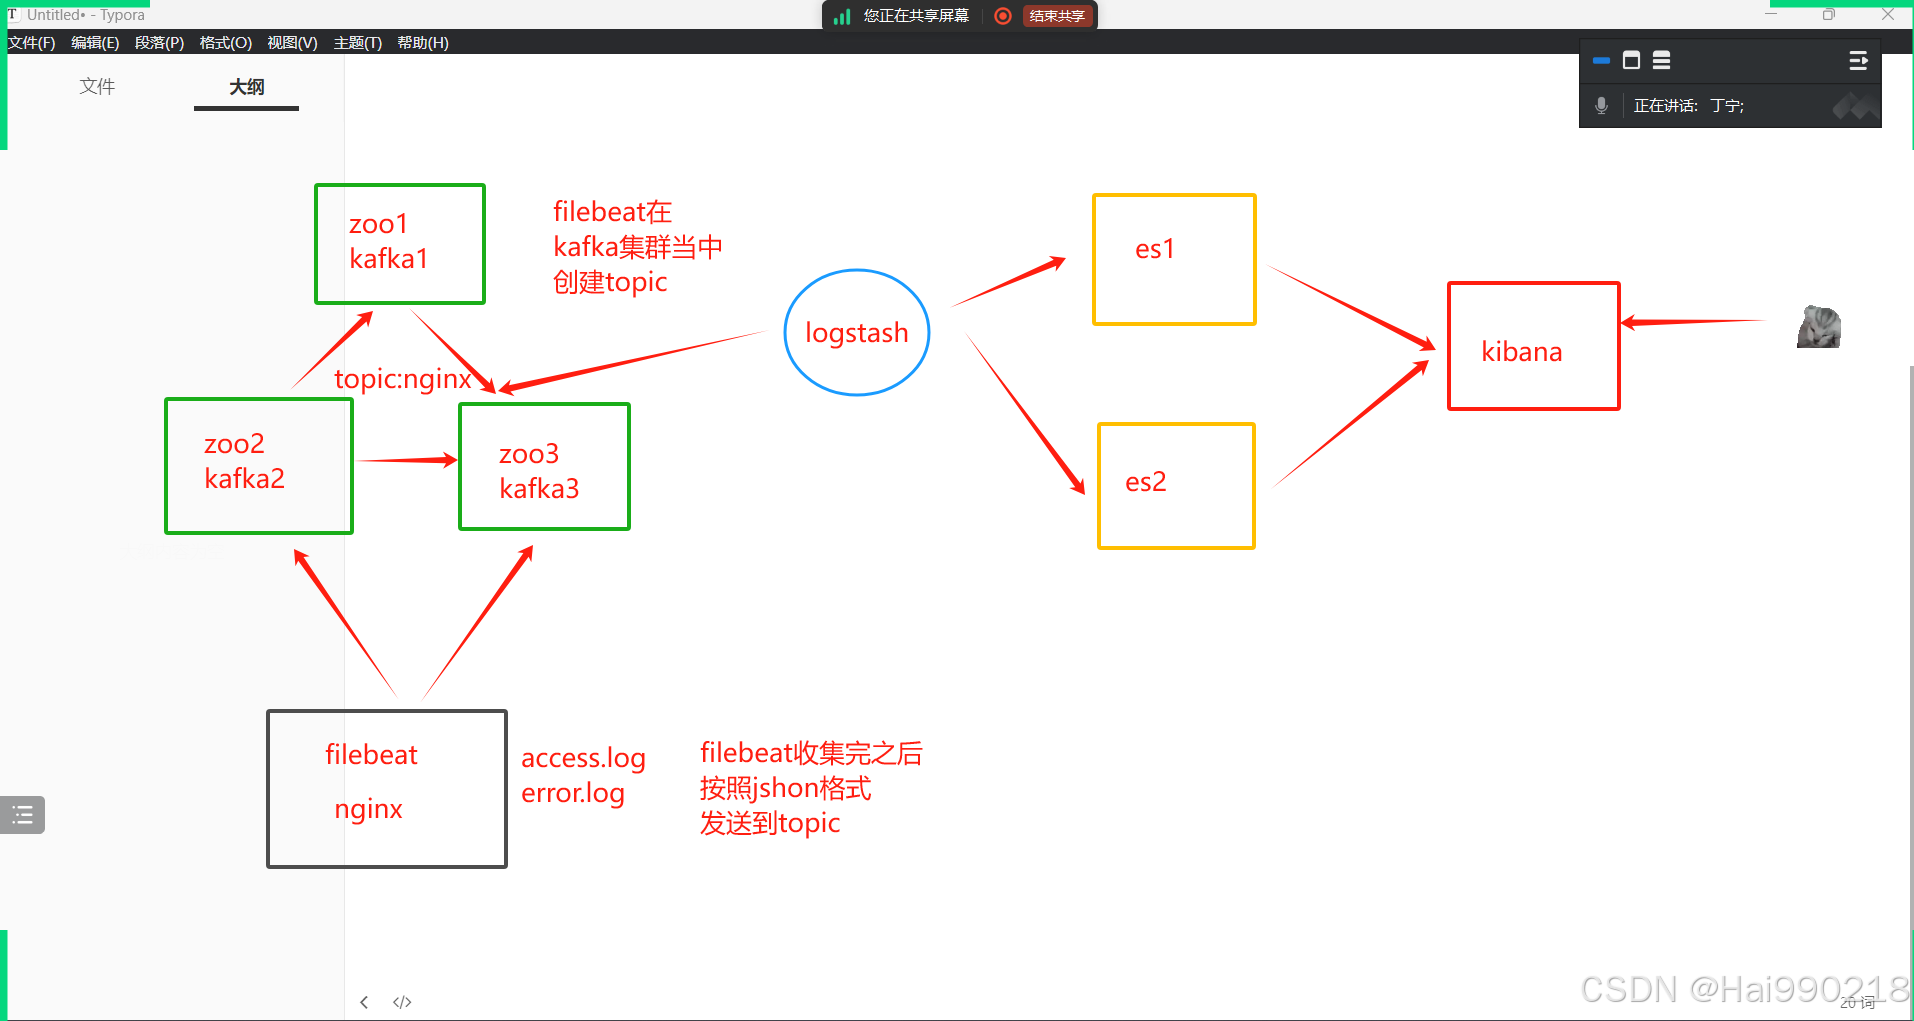
生产者是filebeat
消费者是logstash
架构
192.168.233.10 ES1
192.168.233.20 ES2
192.168.233.30 logstash+Kibana
192.168.233.61 zookeeper+kafka1
192.168.233.62 zookeeper+kafka2
192.168.233.63 zookeeper+kafka3
192.168.233.70 filebeat
实验步骤
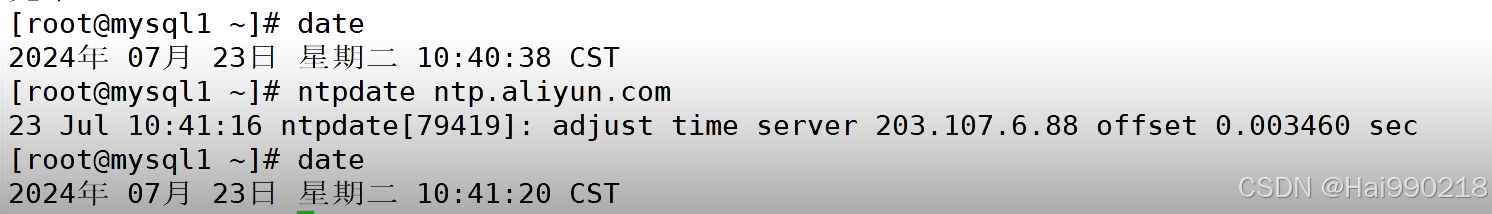
1.安装ntpdate(所有设备都要安装)
yum -y install ntpdate -y
然后查看时间是否一致
ES
2.在10 ES1和20 ES2(同步操作)
yum -y install java
安装 elasticsearch-6.7.2
rpm -ivh elasticsearch-6.7.2.rpm
然后配置elasticsearch
vim /etc/elasticsearch/elasticsearch.yml

ES1改为

ES2改为


然后检查配置文件是否有错
grep -v "^#" /etc/elasticsearch/elasticsearch.yml
systemctl restart elasticsearch.service
netstat -antp | grep 9200
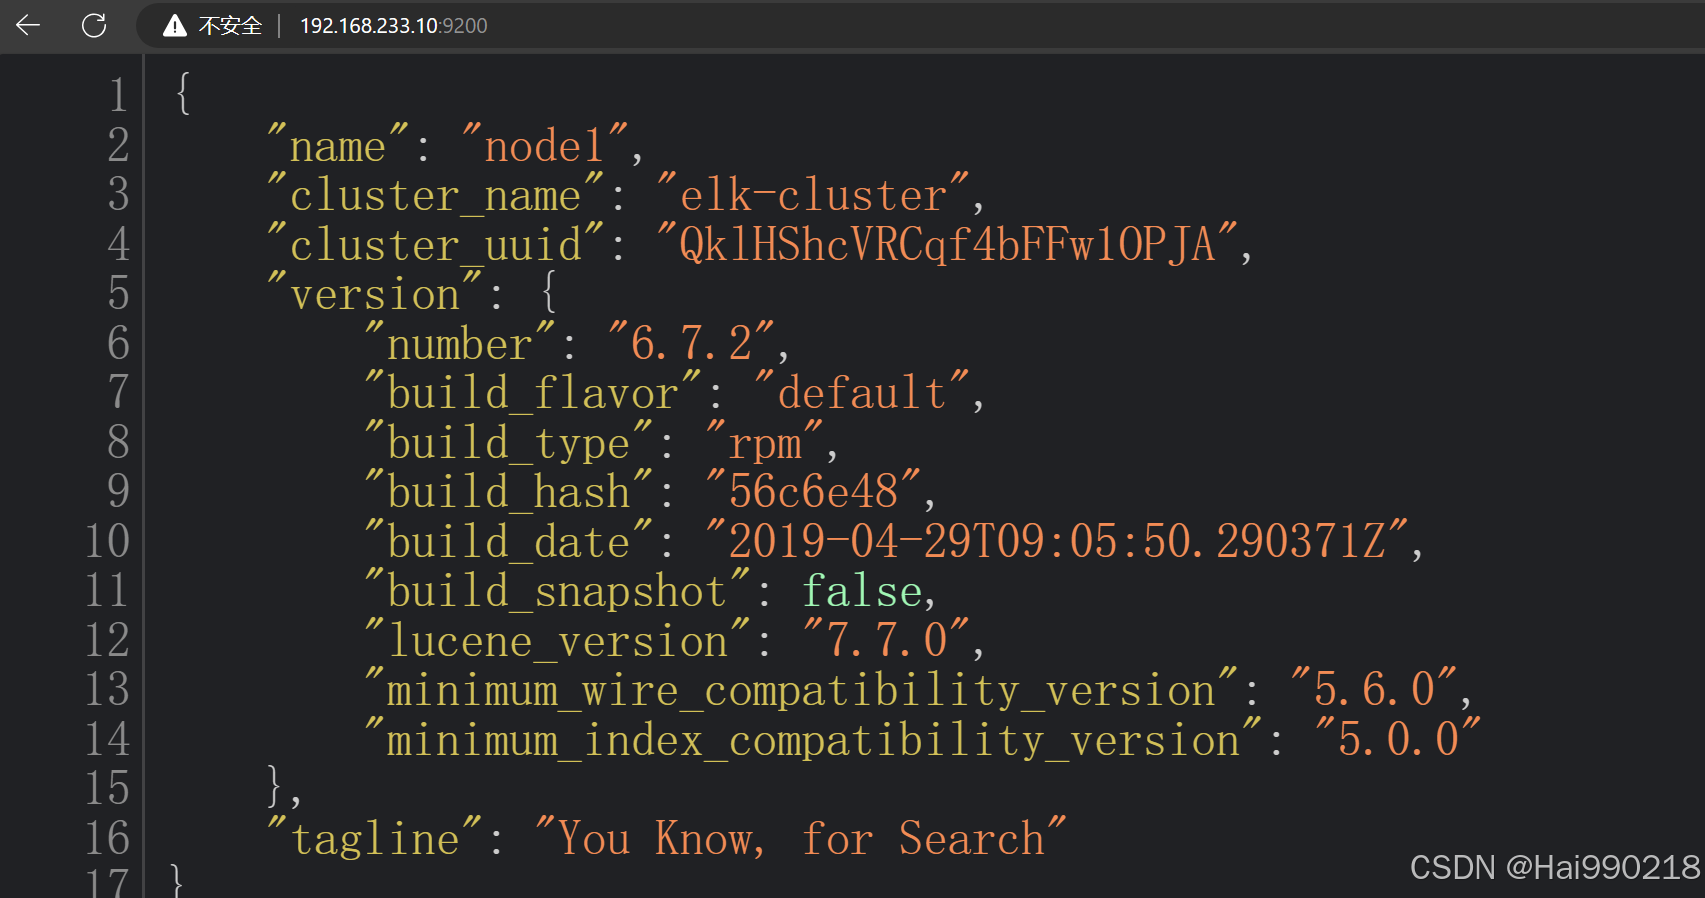
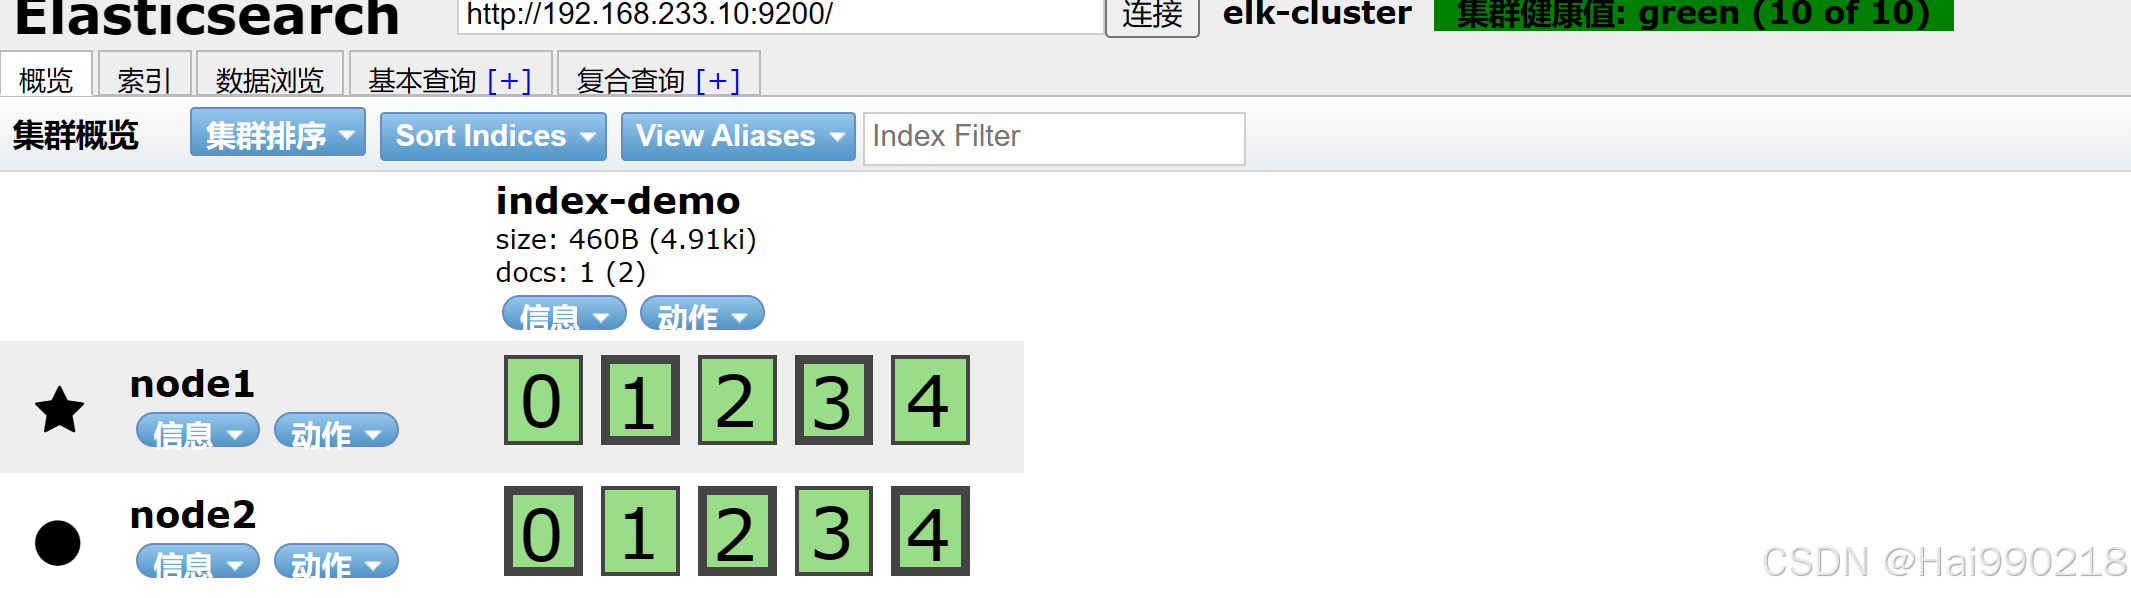
访问浏览器看看是否正常 192.168.233.10:9200
3.在10和20都安装以下三个软件(同步操作)
node:基于谷歌浏览器的运行环境
phantomjs:虚拟浏览器
es-head-master:es的独立可视化工具,可以实现分片索引数据的可视化展示
两台ES同步操作:
把node-v8.2.1.tar、phantomjs-2.1.1-linux-x86_64.tar、elasticsearch-head-master拖进虚拟机
yum -y install gcc gcc-c++ make
tar -xf node-v8.2.1.tar.gz
cd node-v8.2.1/
./configure
make -j 4 && make install
cd /opt/
tar -xf phantomjs-2.1.1-linux-x86_64.tar.bz2
cd /opt/phantomjs-2.1.1-linux-x86_64/
cd bin/
cp phantomjs /usr/local/bin/
cd /opt/
unzip elasticsearch-head-master.zip
cd elasticsearch-head-master/
npm config set registry http://registry.npm.taobao.org/ 指定淘宝镜像
npm install
vim /etc/elasticsearch/elasticsearch.yml
在最后添加

http.cors.enabled: true
http.cors.allow-origin: "*"
然后
systemctl restart elasticsearch.service
netstat -antp | grep 9200
npm run start &
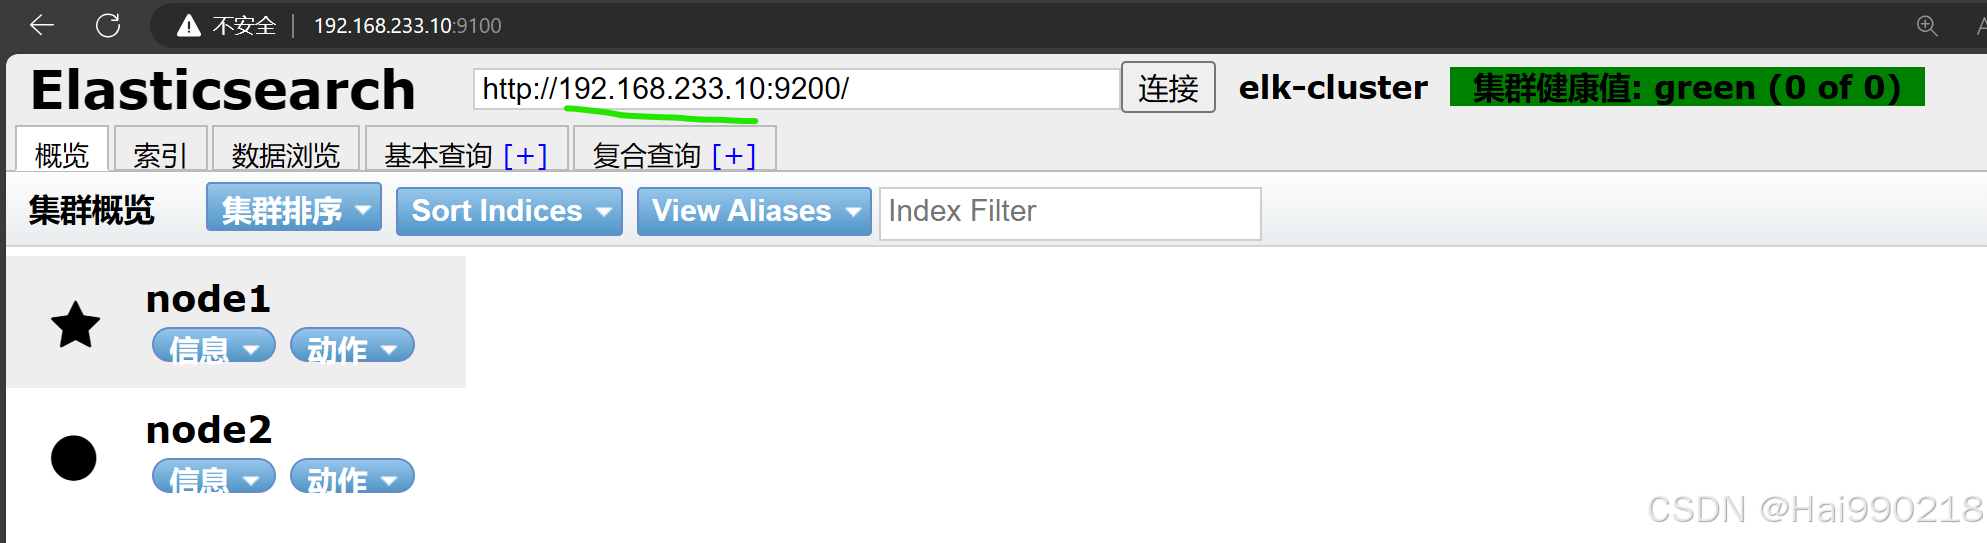
然后访问可视化工具地址 192.168.233.10:9100

然后把localhost换成IP地址
然后在主ES1创建数据(ES也会同步)
curl -X PUT 'localhost:9200/index-demo/test/1?pretty&pretty' -H 'content-Type: application/json' -d '{"user":"zhangsan","mesg":"hello world"}'
logstash
4.在30上操作安装logstash
yum -y install httpd
systemctl restart httpd
yum -y install java
把logstash-6.7.2拖进30虚拟机
rpm -ivh logstash-6.7.2.rpm
systemctl restart logstash.service
ln -s /usr/share/logstash/bin/logstash /usr/local/bin/
cd /etc/logstash/conf.d/
vim kafka.conf
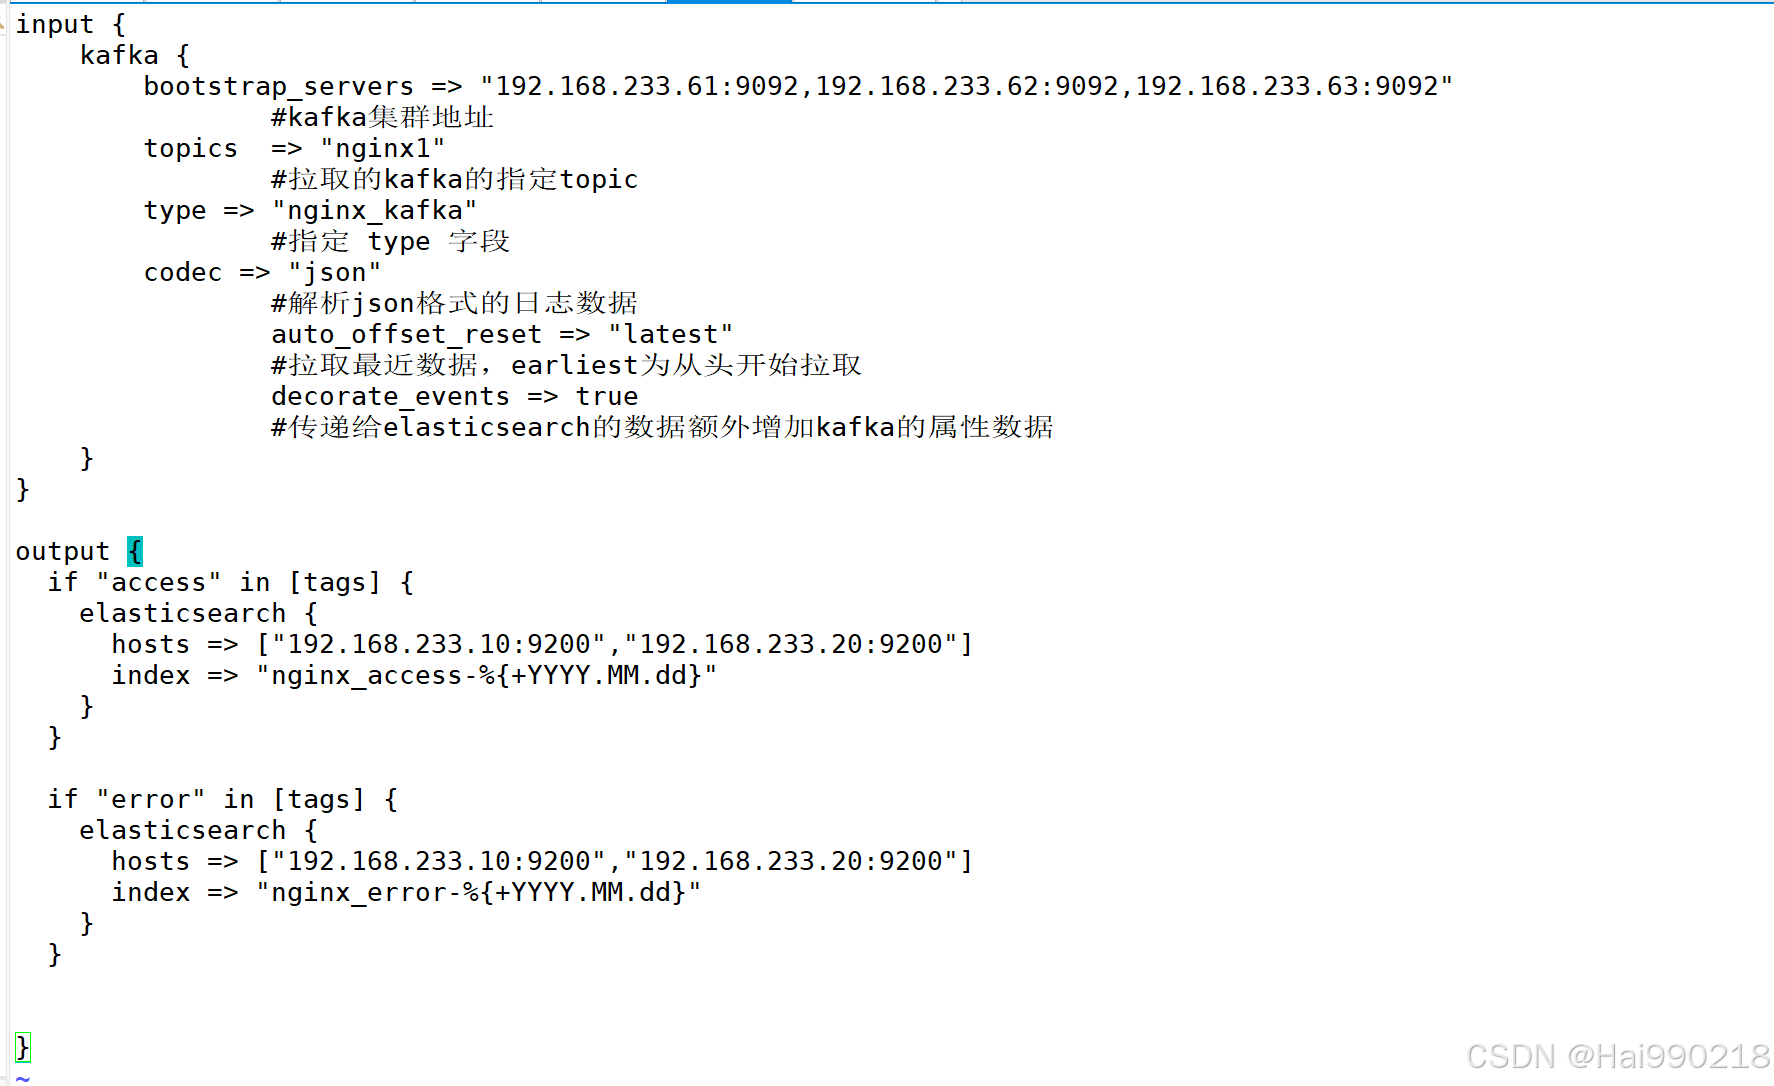
input {
    kafka {
        bootstrap_servers => "192.168.233.61:9092,192.168.233.62:9092,192.168.233.63:9092"
		#kafka集群地址
        topics  => "nginx1"
		#拉取的kafka的指定topic
        type => "nginx_kafka"
		#指定 type 字段
        codec => "json"
		#解析json格式的日志数据
		auto_offset_reset => "latest"
		#拉取最近数据,earliest为从头开始拉取
		decorate_events => true
		#传递给elasticsearch的数据额外增加kafka的属性数据
    }
}

output {
  if "access" in [tags] {
    elasticsearch {
      hosts => ["192.168.233.10:9200","192.168.233.20:9200"]
      index => "nginx_access-%{+YYYY.MM.dd}"
    }
  }

  if "error" in [tags] {
    elasticsearch {
      hosts => ["192.168.233.10:9200","192.168.233.20:9200"]
      index => "nginx_error-%{+YYYY.MM.dd}"
    }
  }

}
kibana
5. 在30上安装kibana
把kibana-6.7.2-x86_64拖入30服务器中
cd /opt/
rpm -ivh kibana-6.7.2-x86_64.rpm
vim /etc/kibana/kibana.yml


然后 touch /var/log/kibana.log
chown kibana.kibana /var/log/kibana.log
systemctl restart kibana.service
systemctl enable kibana.service
结果
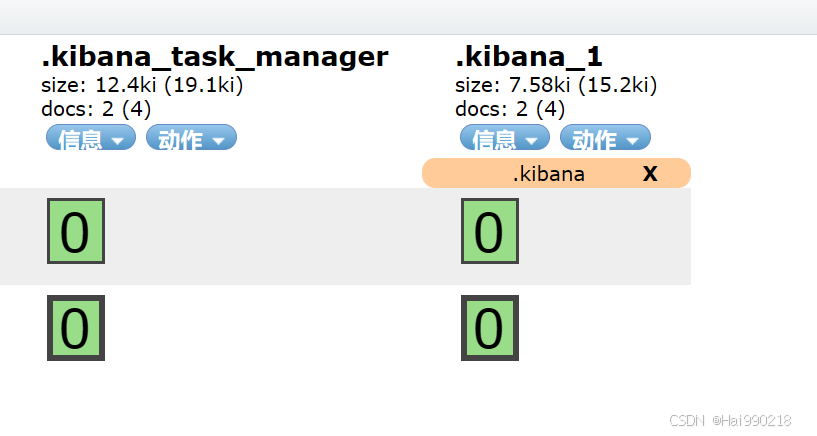
然后访问192.168.233.30:5601
zookeeper
6.安装java(三台都要安装)
yum install -y java-1.8.0-openjdk java-1.8.0-openjdk-devel
7.安装zookeeper(三台都要安装)
把apache-zookeeper-3.5.7-bin.tar拖入到三台虚拟机中
tar -xf apache-zookeeper-3.5.7-bin.tar.gz
mv apache-zookeeper-3.5.7-bin /opt/zookeeper
cd zookeeper/
cd conf/
cp zoo_sample.cfg zoo.cfg
vim zoo.cfg

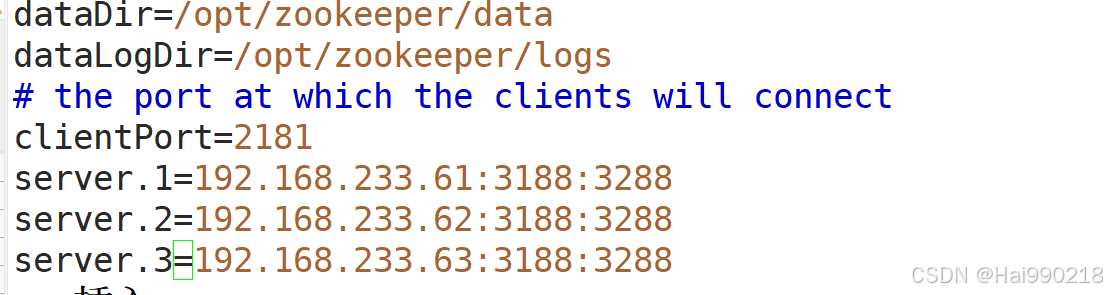
server.1 数字id,也就是服务器对应的myid
3188:zookeeper集群内部通信的端口
3288:重新选举端口,万一leader挂了,用这个端口进行内部通信,选举新的leader
依旧是三台机同步操作
mkdir /opt/zookeeper/data
mkdir /opt/zookeeper/logs
然后分别在61 echo 1 > /opt/zookeeper/data/myid
在62 echo 2 > /opt/zookeeper/data/myid
在63 echo 3 > /opt/zookeeper/data/myid
然后三台机同步操作写一个脚本
vim /etc/init.d/zookeeper
#!/bin/bash
#chkconfig:2345 20 90
#description:Zookeeper Service Control Script
ZK_HOME='/opt/zookeeper'
case $1 in
start)
	echo "---------- zookeeper 启动 ------------"
	$ZK_HOME/bin/zkServer.sh start
;;
stop)
	echo "---------- zookeeper 停止 ------------"
	$ZK_HOME/bin/zkServer.sh stop
;;
restart)
	echo "---------- zookeeper 重启 ------------"
	$ZK_HOME/bin/zkServer.sh restart
;;
status)
	echo "---------- zookeeper 状态 ------------"
	$ZK_HOME/bin/zkServer.sh status
;;
*)
    echo "Usage: $0 {start|stop|restart|status}"
esac
赋权
chmod +x /etc/init.d/zookeeper
chkconfig --add zookeeper
service zookeeper start
kafka
8.安装kafka(三台虚拟机同时操作)
把kafka_2.13-3.4.1拖入三台虚拟机
tar -xf kafka_2.13-3.4.1.tgz
mv kafka_2.13-3.4.1 /usr/local/kafka
cd /usr/local/kafka/config/
cp server.properties server.properties.bak
vim server.properties

这里的id就是经纪人的id,每台机器不能一样

指定本机地址,每台机都要改
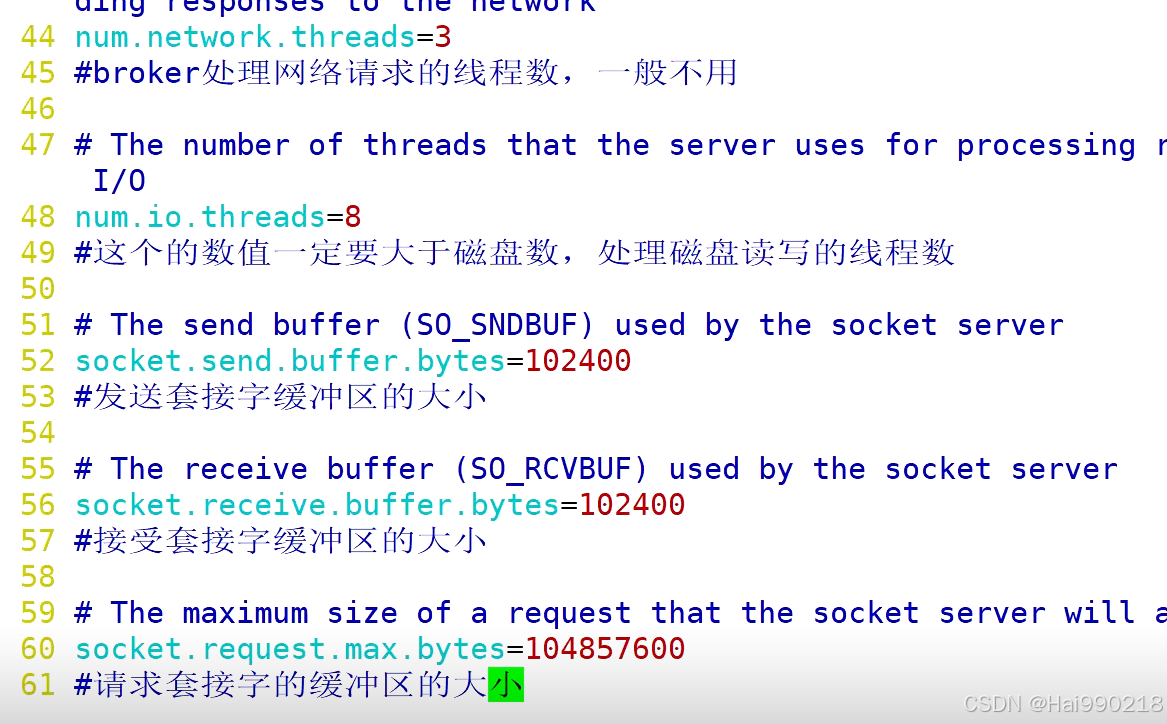

了解即可,一般不动

指定日志位置,三台机都一样

指定zookeeper集群的ip地址,三台机同步
然后 vim /etc/profile (三台机同步)
在最后一行添加
export KAFKA_HOME=/usr/local/kafka
export PATH=$PATH:$KAFKA_HOME/bin
source /etc/profile
然后配置kafka的启动脚本(三台同时操作)
vim /etc/init.d/kafka
#!/bin/bash
#chkconfig:2345 22 88
#description:Kafka Service Control Script
KAFKA_HOME='/usr/local/kafka'
case $1 in
start)
	echo "---------- Kafka 启动 ------------"
	${KAFKA_HOME}/bin/kafka-server-start.sh -daemon ${KAFKA_HOME}/config/server.properties
;;
stop)
	echo "---------- Kafka 停止 ------------"
	${KAFKA_HOME}/bin/kafka-server-stop.sh
;;
restart)
	$0 stop
	$0 start
;;
status)
	echo "---------- Kafka 状态 ------------"
	count=$(ps -ef | grep kafka | egrep -cv "grep|$$")
	if [ "$count" -eq 0 ];then
        echo "kafka is not running"
    else
        echo "kafka is running"
    fi
;;
*)
    echo "Usage: $0 {start|stop|restart|status}"
esac
chmod +x /etc/init.d/kafka
chkconfig --add kafka
service kafka start
netstat -antp | grep 9092 查看kafka的端口是否启动
filebeat
cd /opt/
systemctl restart nginx
tar -xf filebeat-6.7.2-linux-x86_64.tar.gz
mv filebeat-6.7.2-linux-x86_64 /usr/local/filebeat
cd /usr/local/filebeat/
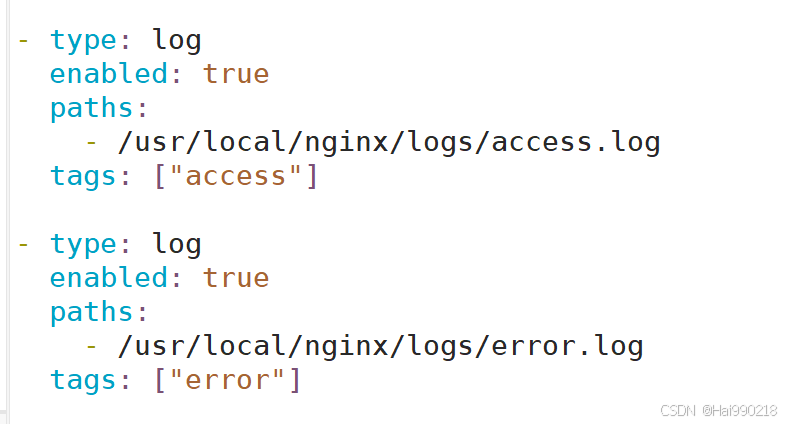
cp filebeat.yml filebeat.yml.bak
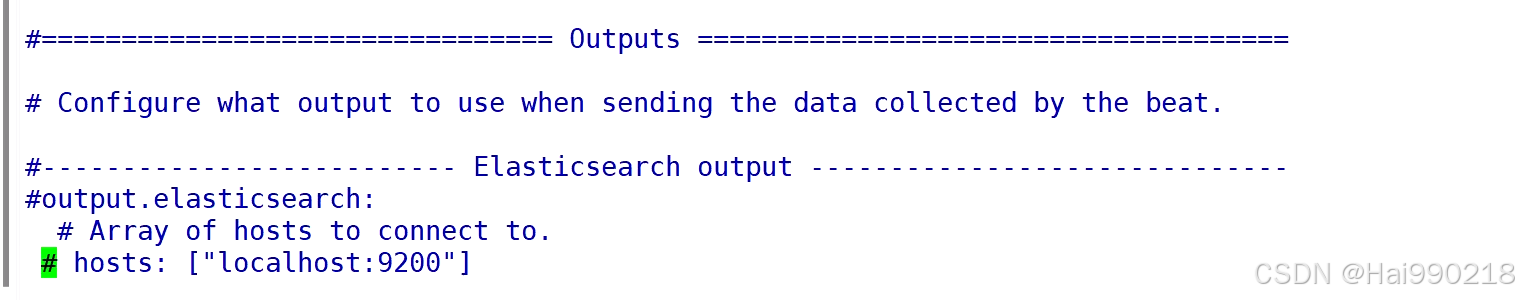
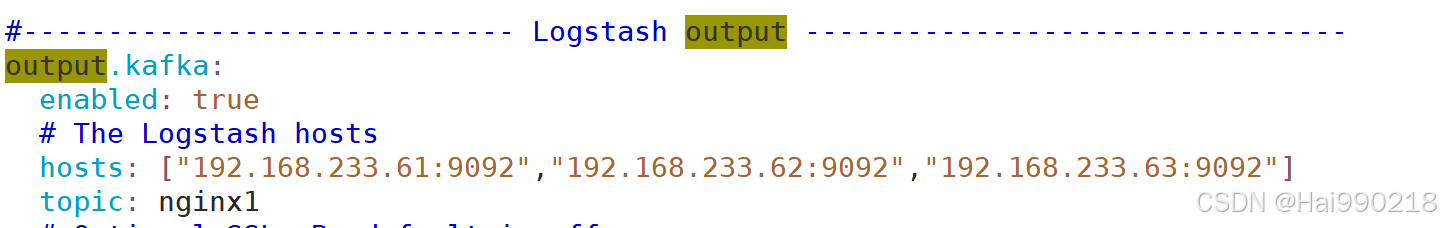
vim filebeat.yml
在第一个output取消注释
实验结果
先启动filebeat
nohup ./filebeat -e -c filebeat.yml > filebeat.out &
再启动logstash
logstash -f kafka.conf --path.data /opt/test5 &
kafka
kafka-console-consumer.sh --bootstrap-server 192.168.233.61:9092,192.168.233.62:9092,192.168.233.63:9092 --topic nginx1 --from-beginning
访问192.168.233.70 logstash消费者就会订阅并消费信息
本站资源均来自互联网,仅供研究学习,禁止违法使用和商用,产生法律纠纷本站概不负责!如果侵犯了您的权益请与我们联系!
转载请注明出处: 免费源码网-免费的源码资源网站 » ELK+Filebeat+Kafka(ELKFK)

发表评论 取消回复