效果
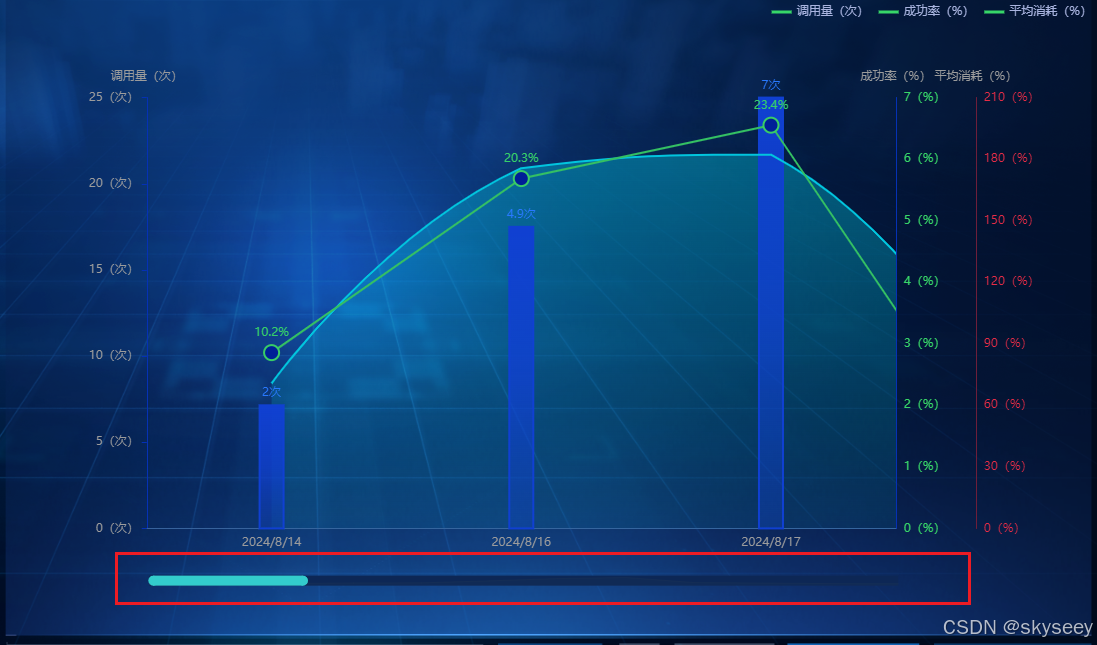
配置:
 let option = {
     dataZoom: [
          {
            type: "slider",
            show: true,
            zoomLock: true,
            start: 0,
            end: 20,
            bottom: 60,
            height: 10,
            textStyle: {
              color: "transparent",
              fontSize: 9,
            },
            fillerColor: "#33CCCC",
            brushSelect: false,
            handleIcon:
                          "path://M30.9,53.2C16.8,53.2,5.3,41.7,5.3,27.6S16.8,2,30.9,2C45,2,56.4,13.5,56.4,27.6S45,53.2,30.9,53.2z M30.9,3.5M36.9,35.8h-1.3z M27.8,35.8 h-1.3H27L27.8,35.8L27.8,35.8z",
            handleSize: "100%",
            handleStyle: {
              color: "#33CCCC",
              borderWidth: 0,
            },
            backgroundColor: "#0d2755", //两边未选中的滑动条区域的颜色
            borderColor: "transparent",
            filterMode: "filter",
          },
        ],
 }
本站资源均来自互联网,仅供研究学习,禁止违法使用和商用,产生法律纠纷本站概不负责!如果侵犯了您的权益请与我们联系!
转载请注明出处: 免费源码网-免费的源码资源网站 » 笔记:Echarts柱状图 实现滚轮条 数据太多

发表评论 取消回复