python计算机视觉编程——8.图像内容分类
8.图像内容分类
8.1 K邻近分类法(KNN)
import numpy as np
class KnnClassifier(object):


    def __init__(self,labels,samples):
        """ 使用训练数据初始化分类器 """

        self.labels = labels
        self.samples = samples

    def classify(self,point,k=3):
        """ 在训练数据上采用k近邻分类,并返回标记 """

        # 计算所有训练数据点的距离
        dist = np.array([L2dist(point,s) for s in self.samples])

        # 对他们进行排序
        ndx = dist.argsort()

        # 用字典存储k近邻
        votes = {}
        for i in range(k):
            label = self.labels[ndx[i]]
            votes.setdefault(label,0)
            votes[label] += 1

        return max(votes, key=lambda x: votes.get(x))


def L2dist(p1,p2):
    return np.sqrt( sum( (p1-p2)**2) )
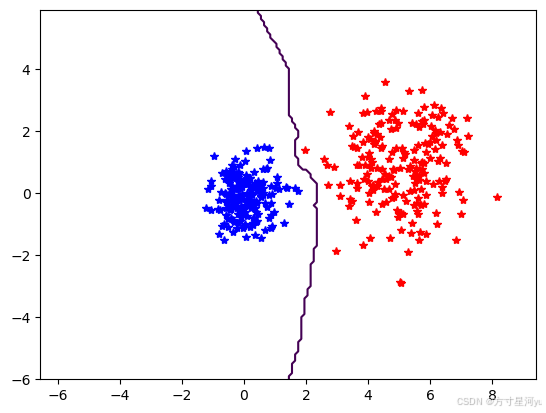
8.1.1 一个简单的二维示例
from numpy.random import randn
import pickle
n=200
class_1=0.6*randn(n,2)
class_2=1.2*randn(n,2)+np.array([5,1])
labels=np.hstack((np.ones(n),-np.ones(n)))
# print(class_1)
with open('points_normal.pkl','wb') as f:
pickle.dump(class_1,f)
pickle.dump(class_2,f)
pickle.dump(labels,f)
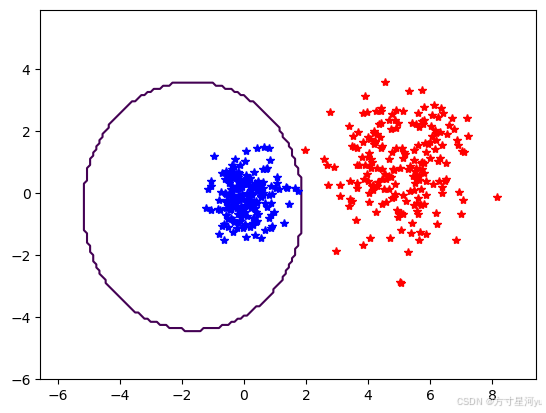
class_1=0.6*randn(n,2)
r=0.8*randn(n,1)+5
angle=2*np.pi*randn(n,1)
class_2=np.hstack((r*np.cos(angle),r*np.sin(angle)))
labels=np.hstack((np.ones(n),-np.ones(n)))
with open('points_ring.pkl','wb') as f:
pickle.dump(class_1,f)
pickle.dump(class_2,f)
pickle.dump(labels,f)
with open('points_normal.pkl','rb') as f:
    class_1=pickle.load(f)
    class_2=pickle.load(f)
    labels=pickle.load(f)

model=KnnClassifier(labels,np.vstack((class_1,class_2)))

# with open('points_ring.pkl','rb') as f:
#     class_1=pickle.load(f)
#     class_2=pickle.load(f)
#     labels=pickle.load(f)

# print(model.classify(class_1[0]))
from pylab import *

def plot_2D_boundary(plot_range,points,decisionfcn,labels,values=[0]):
    """    Plot_range is (xmin,xmax,ymin,ymax), points is a list
        of class points, decisionfcn is a funtion to evaluate,
        labels is a list of labels that decisionfcn returns for each class,
        values is a list of decision contours to show. """

    clist = ['b','r','g','k','m','y'] # colors for the classes

    # evaluate on a grid and plot contour of decision function
    x = arange(plot_range[0],plot_range[1],.1)
    y = arange(plot_range[2],plot_range[3],.1)
    xx,yy = meshgrid(x,y)
    xxx,yyy = xx.flatten(),yy.flatten() # lists of x,y in grid
    zz = array(decisionfcn(xxx,yyy))
    zz = zz.reshape(xx.shape)
    # plot contour(s) at values
    contour(xx,yy,zz,values)

    # for each class, plot the points with '*' for correct, 'o' for incorrect
    for i in range(len(points)):
        d = decisionfcn(points[i][:,0],points[i][:,1])
        correct_ndx = labels[i]==d
        incorrect_ndx = labels[i]!=d
        plot(points[i][correct_ndx,0],points[i][correct_ndx,1],'*',color=clist[i])
        plot(points[i][incorrect_ndx,0],points[i][incorrect_ndx,1],'o',color=clist[i])

    axis('equal')
def classify(x,y,model=model):
    return np.array([model.classify([xx,yy]) for (xx,yy) in zip(x,y)])
plot_2D_boundary([-6,6,-6,6],[class_1,class_2],classify,[1,-1])
show()
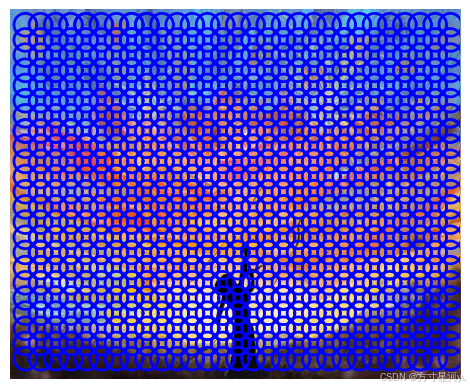
8.1.2 用稠密SIFT作为图像特征
from PIL import Image
import os
def process_image_dsift(imagename,resultname,size=20,steps=10,
                       force_orientation=False,resize=None):
    im=Image.open(imagename).convert('L')
    if resize!=None:
        im=im.resize(resize)
    m,n=im.size

    if imagename[-3:]!='pgm':
        im.save('tmp.pgm')
        imagename='tmp.pgm'
    scale=size/3.0
    x,y=meshgrid(range(steps,m,steps),range(steps,n,steps))
    xx,yy=x.flatten(),y.flatten()
    frame=np.array([xx,yy,scale*ones(xx.shape[0]),zeros(xx.shape[0])])
    savetxt('tmp.frame',frame.T,fmt='%03.3f')

    if force_orientation:
        cmmd=str("sift "+imagename+" --output="+resultname+
                " --read-frames=tmp.frame --orientations")
    else:
        cmmd=str("sift "+imagename+" --output="+resultname+
                " --read-frames=tmp.frame")
    os.system(cmmd)
    print('processed',imagename,'to',resultname)
def read_features_from_file(filename):
    f=loadtxt(filename)
#     print("Array shape:", f.shape)  # 打印数组的形状以调试
    #因为前四列是兴趣点的坐标,尺度和方向角度,后128列是用整数数值表示的描述子
    return f[:,:4],f[:,4:]
def plot_features(im,locs,circle=False):
    def draw_circle(c,r):
        t=arange(0,1.01,.01)*2*pi
        x=r*cos(t)+c[0]
        y=r*sin(t)+c[1]
        plot(x,y,'b',linewidth=2)
        imshow(im)
    if circle:
        for p in locs:
            draw_circle(p[:2],p[2])
    else:
        plot(locs[:,0],locs[:,1],'ob')
    axis('off')
process_image_dsift('sun.jpg','sun.sift',90,40,True)
l,d=read_features_from_file('sun.sift')

im=np.array(Image.open('sun.jpg'))
plot_features(im,l,True)
show()
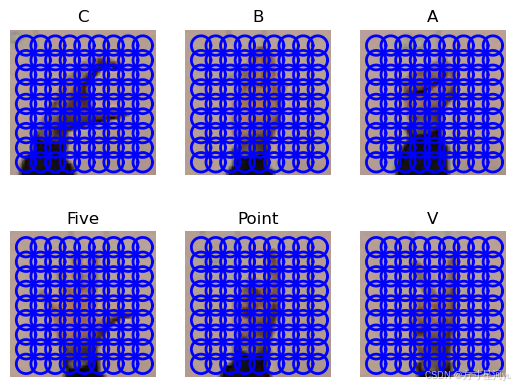
8.1.3 图像分类:手势识别
def get_imlist(path,endIdentifier):
    return [os.path.join(path,f) for f in os.listdir(path) if f.endswith(endIdentifier)]
imlist=get_imlist(r'.\train','.ppm')
imtestlist=get_imlist(r'.\test','.ppm')
for filename in imlist:
    featfile=filename[:-3]+'dsift'
    process_image_dsift(filename,featfile,10,5,resize=(50,50))
for filename in imtestlist:
    featfile=filename[:-3]+'dsift'
    process_image_dsift(filename,featfile,10,5,resize=(50,50))
imlist = [r'./train/C-uniform01.ppm', r'./train/B-uniform01.ppm',
          r'./train/A-uniform01.ppm', r'./train/Five-uniform01.ppm',
          r'./train/Point-uniform01.ppm', r'./train/V-uniform01.ppm']
featlist=[]
for filename in imlist:
    featfile=filename[:-3]+'dsift'
    featlist.append(featfile)
# print(imlist)
# print(featlist)

for index,item in enumerate(imlist):
    dirpath, filename = os.path.split(imlist[index])
    im = array(Image.open(imlist[index]).resize((50, 50)))
    titlename = filename[:-14]
    subplot(2, 3, index + 1)

    l,d = read_features_from_file(featlist[index])
    plot_features(im, l, True)
    title(titlename)
def read_gesture_features_labels(path):
    # create list of all files ending in .dsift
    featlist = [os.path.join(path,f) for f in os.listdir(path) if f.endswith('.dsift')]
    # read the features
    features = []
    for featfile in featlist:
        #  print(index)
        l,d = read_features_from_file(featfile)

        features.append(d.flatten())
    features = array(features)
    # create labels
    labels = [featfile.split('/')[-1][0] for featfile in featlist]
    return features,array(labels)
features,labels=read_gesture_features_labels(r'.\train\\')
test_features,test_labels=read_gesture_features_labels(r'.\test\\')

classnames=np.unique(labels)
k=1
knn_classifier=KnnClassifier(labels,features)
res=array([knn_classifier.classify(test_features[i],k) for i in
          range(len(test_labels))])

acc=sum(1.0*(res==test_labels))/len(test_labels)
print('Accuracy:',acc)
def print_confusion(res,labels,classnames):
    n=len(classnames)
    class_ind=dict([(classnames[i],i) for i in range(n)])

    confuse=zeros((n,n))
    for i in range(len(test_labels)):
        confuse[class_ind[res[i]],class_ind[test_labels[i]]]+=1

    print('Confusion matrix for')
    print(classnames)
    print(confuse)
8.2贝叶斯分类器
import numpy as np
import pickle
from pylab import *
class BayesClassifier(object):

    def __init__(self):
        """ Initialize classifier with training data. """

        self.labels = []    # class labels
        self.mean = []        # class mean
        self.var = []        # class variances
        self.n = 0            # nbr of classes

    def train(self,data,labels=None):
        """ Train on data (list of arrays n*dim).
            Labels are optional, default is 0...n-1. """

        if labels==None:
            labels = range(len(data))
        self.labels = labels
        self.n = len(labels)

        for c in data:
            self.mean.append(np.mean(c,axis=0))
            self.var.append(np.var(c,axis=0))

    def classify(self,points):
        """ Classify the points by computing probabilities
            for each class and return most probable label. """

        # compute probabilities for each class
        est_prob = np.array([gauss(m,v,points) for m,v in zip(self.mean,self.var)])

        print('est prob',est_prob.shape,self.labels)
        # get index of highest probability, this gives class label
        ndx = est_prob.argmax(axis=0)

        est_labels = np.array([self.labels[n] for n in ndx])

        return est_labels, est_prob
def gauss(m,v,x):
    """ Evaluate Gaussian in d-dimensions with independent
        mean m and variance v at the points in (the rows of) x.
        http://en.wikipedia.org/wiki/Multivariate_normal_distribution """

    if len(x.shape)==1:
        n,d = 1,x.shape[0]
    else:
        n,d = x.shape

    # covariance matrix, subtract mean
    S = np.diag(1/v)
    x = x-m
    # product of probabilities
    y = np.exp(-0.5*np.diag(np.dot(x,np.dot(S,x.T))))

    # normalize and return
    return y * (2*np.pi)**(-d/2.0) / (np.sqrt(np.prod(v)) + 1e-6)
with open('points_normal.pkl','rb') as f:
    class_1=pickle.load(f)
    class_2=pickle.load(f)
    labels=pickle.load(f)

bc=BayesClassifier()
bc.train([class_1,class_2],[1,-1])
print(bc.classify(class_1[:10])[0])

def classify(x,y,bc=bc):
    points=np.vstack((x,y))
    return bc.classify(points.T)[0]

plot_2D_boundary([-6,6,-6,6],[class_1,class_2],classify,[1,-1])
用PCA降维
from PIL import Image
from numpy import *


def pca(X):
    """    Principal Component Analysis
        input: X, matrix with training data stored as flattened arrays in rows
        return: projection matrix (with important dimensions first), variance and mean.
    """

    # get dimensions
    num_data,dim = X.shape

    # center data
    mean_X = X.mean(axis=0)
    X = X - mean_X

    if dim>num_data:
        # PCA - compact trick used
        M = dot(X,X.T) # covariance matrix
        e,EV = linalg.eigh(M) # eigenvalues and eigenvectors
        tmp = dot(X.T,EV).T # this is the compact trick
        V = tmp[::-1] # reverse since last eigenvectors are the ones we want
        S = sqrt(e)[::-1] # reverse since eigenvalues are in increasing order
        for i in range(V.shape[1]):
            V[:,i] /= S
    else:
        # PCA - SVD used
        U,S,V = linalg.svd(X)
        V = V[:num_data] # only makes sense to return the first num_data

    # return the projection matrix, the variance and the mean
    return V,S,mean_X


def center(X):
    """    Center the square matrix X (subtract col and row means). """

    n,m = X.shape
    if n != m:
        raise Exception('Matrix is not square.')

    colsum = X.sum(axis=0) / n
    rowsum = X.sum(axis=1) / n
    totalsum = X.sum() / (n**2)

    #center
    Y = array([[ X[i,j]-rowsum[i]-colsum[j]+totalsum for i in range(n) ] for j in range(n)])

    return Y
V,S,m=pca(features)

V=V[:50]
features=np.array([np.dot(V,f,-m) for f in features])
# test_features=np.array([np.dot(V,f,-m) for f in test_features])

bc=BayesClassifier()
blist=[features[where(labels==c)[0]] for c in classnames]
bc.train(blist,classnames)
# res=bc.classify(test_features)[0]
acc=sum(1.0*(res==test_labels))/len(test_labels)
print('Accuracy:',acc)
8.3 支持向量机
import pickle
from svmutil import *
with open('points_normal.pkl','rb') as f:
    class_1=pickle.load(f)
    class_2=pickle.load(f)
    labels=pickle.load(f)

class_1=map(list,class_1)
class_2=map(list,class_2)
labels=list(labels)
samples=class_1+class_2

prob=svm_problem(labels,samples)
param=svm_parameter('-t 2')

m=svm_train(prob,param)

res=svm_predict(labels,samples,m)
with open('points_normal_test.pkl','rb') as f:
    class_1=pickle.load(f)
    class_2=pickle.load(f)
    labels=pickle.load(f)

class_1=map(list,class_1)
class_2=map(list,class_2)

def predict(x,y,model=m):
    return array(svm_predict([0]*len(x),zip(x,y),model)[0])

plot_2D_boundary([-6,6,-6,6],[class_1,class_2],classify,[1,-1])
show()
8.3.2 再论手势识别
features=map(list,features)
test_features=map(list,test_features)

transl={}
for i,c in enumerate(classnames):
    transl[c],trans[i]=i,c

prob=svm_problem(convert_labels(labels,transl),features)
param=svm_paramter('-t 2')


m=svm_train(prob,param)

res=svm_predict(covert_labels(labels,transl),features,m)

res=svm_predict(convert_labels(test_labelss,transl),test_features,m)[0]
res=convert_labels(res,transl)
acc=sum(1.0*(res==test_labels))/len(test_labels)
print('Accuracy:',acc)

print_confusion(res,test_labels,classnames)
8.4 光学字符识别
8.4.2 选取特征
def compute_feature(im):
    norm_im=imresize(im,(30,30))
    norm_im=norm_im[3:-3,3:-3]
    return norm_im.flatten()
def load_ocr_data(path):
    imlist=[os.path.join(path,f) for f in os.listdir(path) if f.endswith('.jpg')]
    labels=[int(imfile.split('/')[-1][0]) for imfile in imlist]
    features=[]
    for imname in imlist:
        im =array(Image.open(imname).convert('L'))
        features.append(compute_feature(im))
    return array(features),labels
8.4.3 多类支持向量机
from svmutil import *
features,labels=load_ocr_data('training/')

test_features,test_labels=load_ocr_data('testing/')

features=map(list,features)
test_features=map(list,test_features)

prod=svm_problem(labels,features)
param=svm_parameter('-t 0')

m=svm_train(prob,param)

res=svm_predict(labels,features,m)

res=svm_predict(test_labels,test_features,m)
8.4.4 提取单元格并识别字符
from scipy.ndimage import measurements

def find_sudoku_edges(im,axis=0):

    trim=1*(im<128)
    s=trim.sum(axis=axis)

    s_labels,s_nbr=measurements.label(s>(0.5*max(s)))

    m=measurements.center_of_mass(s,s_labels,range(1,s_nbr+1))

    x=[int(x[0]) for x in m]

    if lem(x)==4:
        dx=diff(x)
        x=[x[0],x[0]+dx[0]/3,x[0]+2*dx[0]/3,
          x[1],x[1]+dx[1]/3,x[1]+2*dx[1]/3,
          x[2],x[2]+dx[2]/3,x[2]+2*dx[2]/3,x[3]]

        if len(x)==10:
            return x
        else:
            raise RuntimeError('Edges not detected')
imname='sudokus/sudoku18.jpg'
vername='sudokus/sudoku18.sud'
im=array(Image.open(imname).convert('L'))

x=find_sudoku_edges(im,axis=0)
y=find_sudoku_edges(im,axis=1)

crops=[]
for col in range(9):
    for row in range(9):
        crop=im[y[col]:y[col+1],x[row]:x[row+1]]
        crops.append(compute_feature(crop))
res=svm_predict(loadtxt(vername),map(list,crops),m)[0]
res_im=array(res).reshape(9,9)

print('Result:')
print(res_im)
8.4.5 图像校正
from scipy import ndimage

imname='sudoku8.jpg'
im=array(Image.open(imname).convert('L'))

figure()
imsshow(im)
gray()
x=ginput(4)

fp=array([array([p[1],p[0],1]) for p in x]).T
tp=array([[0,0,1],[0,1000,1],[1000,1000,1],[1000,0,1]]).T

H=H_from_points(tp,fp)

def warpfcn(x):
    x=array([x[0],x[1],1])
    xt=dot(H,x)
    xt=xt/xt[2]
    return xt[0],xt[1]

im_g=ndimage.geometric_transform(im,warpfcn,(1000,1000))
本站资源均来自互联网,仅供研究学习,禁止违法使用和商用,产生法律纠纷本站概不负责!如果侵犯了您的权益请与我们联系!
转载请注明出处: 免费源码网-免费的源码资源网站 » 【python计算机视觉编程——8.图像内容分类】

发表评论 取消回复