在我们日常可能会有小程序中要使用echarts,我今天总结了一下整个引入的步骤
首先echarts - DCloud 插件市场在插件市场里面导入进项目,我这边用的是vue3的以及主要开发小程序,就直接放我的案例了
按照上面的步骤,在样式部分这样写
<view style="width:750rpx; height:750rpx"><l-echart ref="chartRef"></l-echart></view>
然后在js部分引入
// 小程序 二选一
// 插件内的 二选一
const echarts = require('../../uni_modules/lime-echart/static/echarts.min');
// 自定义的 二选一 下载后放入项目的路径
const echarts = require('xxx/xxx/echarts');

//~~~~~~~~~~~~~~~~~~~~~~~~~~~~~~~~~~~~~~~~~~~~~~~~~~~
// 非小程序
// 需要在控制台 输入命令:npm install echarts
import * as echarts from 'echarts'
下面是使用方法
const chartRef = ref(null)
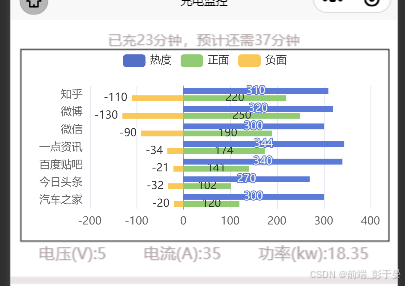
const option = {
tooltip: {
trigger: 'axis',
axisPointer: {
type: 'shadow'
},
confine: true
},
legend: {
data: ['热度', '正面', '负面']
},
grid: {
left: 20,
right: 20,
bottom: 15,
top: 40,
containLabel: true
},
xAxis: [
{
type: 'value',
axisLine: {
lineStyle: {
color: '#999999'
}
},
axisLabel: {
color: '#666666'
}
}
],
yAxis: [
{
type: 'category',
axisTick: { show: false },
data: ['汽车之家', '今日头条', '百度贴吧', '一点资讯', '微信', '微博', '知乎'],
axisLine: {
lineStyle: {
color: '#999999'
}
},
axisLabel: {
color: '#666666'
}
}
],
series: [
{
name: '热度',
type: 'bar',
label: {
normal: {
show: true,
position: 'inside'
}
},
data: [300, 270, 340, 344, 300, 320, 310],
},
{
name: '正面',
type: 'bar',
stack: '总量',
label: {
normal: {
show: true
}
},
data: [120, 102, 141, 174, 190, 250, 220]
},
{
name: '负面',
type: 'bar',
stack: '总量',
label: {
normal: {
show: true,
position: 'left'
}
},
data: [-20, -32, -21, -34, -90, -130, -110]
}
]
};
onMounted( ()=>{
// 组件能被调用必须是组件的节点已经被渲染到页面上
setTimeout(async()=>{
if(!chartRef.value) return
const myChart = await chartRef.value.init(echarts)
myChart.setOption(option)
},300)
})按照上面流程可能会不出现实例,可能会获取到的ref为null,这是正常的
有可能导入的时候这个组件没注册,下面我们找下导入的组件位置,手动给它注册一下
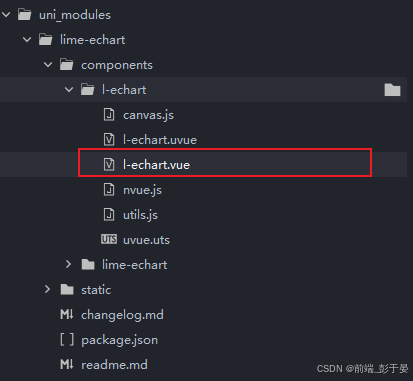
找到这个文件的位置,然后我们直接在main.js中注册
下面是main.js部分的代码
import lEchart from '@/uni_modules/lime-echart/uni_modules/lime-echart/components/l-echart/l-echart.vue'

Vue.component('l-echart', lEchart)
然后前面的示例就能出现了
本站资源均来自互联网,仅供研究学习,禁止违法使用和商用,产生法律纠纷本站概不负责!如果侵犯了您的权益请与我们联系!
转载请注明出处: 免费源码网-免费的源码资源网站 » uniapp中使用echarts 完整步骤,包括报错以及解决方案

发表评论 取消回复